
Less toil is, more or less, good. Frances Coppola explains.
We work less than we used to. That’s the key finding of the Office of National Statistics’ (ONS’s) review of its productivity methodology.
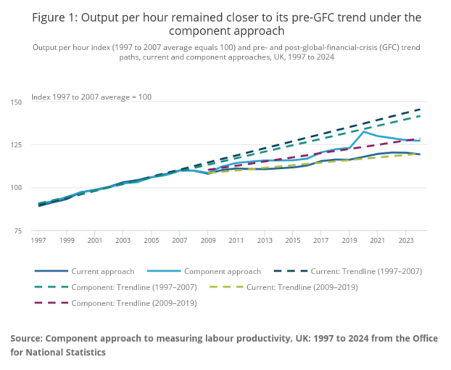
The ONS has changed how it measures productivity. As a result, it has now concluded that rather than productivity falling off a cliff in the 2007-8 financial crisis, it was more of a slow decline:
“The new improved figures show falling average actual hours worked per job and slower growth in total hours worked since 2008, and consequently higher growth in productivity per hour. Our previous estimates suggested UK labour productivity per hour grew at an average annual rate of 2.1% before 2008 and 0.7% thereafter. Today’s improved estimates indicate that productivity grew a little slower before 2008, at 2.0%, while it grew at an average of 1.3% from 2009 to 2019.”
Here’s the ONS’s nice chart showing how the new methodology changes both actual and estimated productivity before and after the financial crisis:
Economists have spent a great deal of time trying to explain why the UK’s productivity growth has been much lower since the financial crisis than before it. Much ink has been spilt. But no definite conclusion has ever been reached.
But of course all this analytical effort was based on the ONS’s estimates of productivity – which we now know were wrong. Productivity was lower before the financial crisis than the ONS previously thought, and higher after it. And it’s all because we are working less than the ONS thought we were.
Labour productivity is average output per worker per hour. If ten people work for five hours each and produce 100 widgets between them, then their productivity is 100/5*10 = 2. This doesn’t mean they each make 2 widgets per hour: a highly experienced worker might make four widgets per hour, while a raw trainee might only manage one.
If the same group of people work four hours each to produce 100 widgets, their productivity is 100/4*10 = 2.5. It has gone up. This is why the ONS’s finding that we are working less than it thought increases its productivity estimates.
Despite gleeful newspaper headlines about ONS’s mismeasurement, the “productivity puzzle” hasn’t gone away.
But there’s a problem. The ONS’s data shows that average hours worked have been declining since the 1990s. Men’s hours fell from 39.1 in 1991 to 36 in 2019, while women’s increased, but not by as much. And the financial crisis didn’t make much difference. There was a short-term drop in hours worked, but it rebounded quickly. Over the longer term, it doesn’t even show on the chart.
So why does the ONS’s chart still show a structural fall in the rate of productivity growth from 2008 onwards? Despite gleeful newspaper headlines about ONS’s mismeasurement, the “productivity puzzle” hasn’t gone away.
There are some potential labour market explanations. Despite relatively high unemployment after the financial crisis, the Coalition and Conservative governments cut welfare programmes to force people who had previously been living on benefits into work. Single mothers, sick and disabled people, students, older women whose state pension age was rising – all were expected to find jobs. And many did, but they tended to be low-paid, part-time, or casual jobs, often on a self-employed basis. To make matters worse, the Government also cut public sector employment, which disproportionately affected women. Just as men’s unemployment was starting to recover after the financial crisis, women’s unemployment rose.
Is the ONS really sure about its employment numbers?
The productivity slump and associated wage stagnation of the 2010s can be partly attributed to welfare and public sector employment cuts that brought a lot more people into the jobs market when jobs were already scarcer than before the crisis. And there’s a second factor too.
Even in jobs considered “unskilled”, such as fruit picking, the skill and experience of the workers affects productivity. If you bring into the workforce a lot of people whose rate of production is slower than average, perhaps because of sickness or disability, or because they are unused to that type of work, the productivity of the whole workforce will fall. This is known as hysteresis. It probably partly explains the UK’s poor productivity growth in the 2010s.
Employment numbers have risen significantly in recent years, partly because welfare cuts and rising state pension age have forced people into work, but mainly because of immigration. We’ve generated economic growth by increasing the number of workers. But the hours people work have continued to fall – which as the ONS points out, actually increases productivity. If average hours worked had remained as high as they were in the 1990s, growth might be higher, but (all else being equal) productivity would be lower. Yes, I know it doesn’t make sense. Growth has been as disappointing as productivity. Is the ONS really sure about its employment numbers?
But maybe the productivity puzzle isn’t about the amount we work at all. Could the ONS’s revisions be merely a fine red herring?
The cure is surely obvious.
Productivity growth can arise from technological advancement. If you replace your creaking old lawnmower with a state-of-the-art cordless robotic machine, you can mow your lawn in half the time with much less effort. The new technology has increased your productivity.
Many economists (including me) have blamed the UK’s poor productivity growth since the financial crisis on an investment chill caused by repeated shocks: the financial crisis itself, the Euro crisis, the Brexit vote, Covid, the Ukraine war… there’s always a reason not to invest.
There’s no doubt there was an investment chill. Banks cut back lending hard after the financial crisis, especially to smaller businesses, so the private sector was starved of domestic risk capital. The Euro crisis and the Brexit vote frightened international investors away. And ignoring the well-proven argument that if the private sector can’t or won’t invest, the public sector must, the government cut public sector investment to the bone. The question is: what impact did inadequate investment after the financial crisis have on productivity growth? The ONS’s revisions suggest it was not as bad as we thought. But it’s clearly not zero.
The ONS’s revisions put the UK’s productivity growth more-or-less on a par with that of other G7 nations. We aren’t the only country experiencing a productivity puzzle. And to me, that points to inadequate investment as the most likely explanation of the UK’s poor productivity growth since the financial crisis. Labour markets are domestic, but investment is international. If you are seeing a common pattern across several nations, the underlying cause is almost certainly international.
The cure is surely obvious. We need investment. Lots of it, both private and public. Bring on the productivity-enhancing technologies that make our work more productive, so we can produce more while working less. When we spend less time working, we have more time for family, friends and leisure – the things that make us human.
As Bertrand Russell said in his essay In Praise of Idleness: “Hitherto we have continued to be as energetic as we were before there were machines. In this we have been foolish, but there is no reason to go on being foolish for ever.”